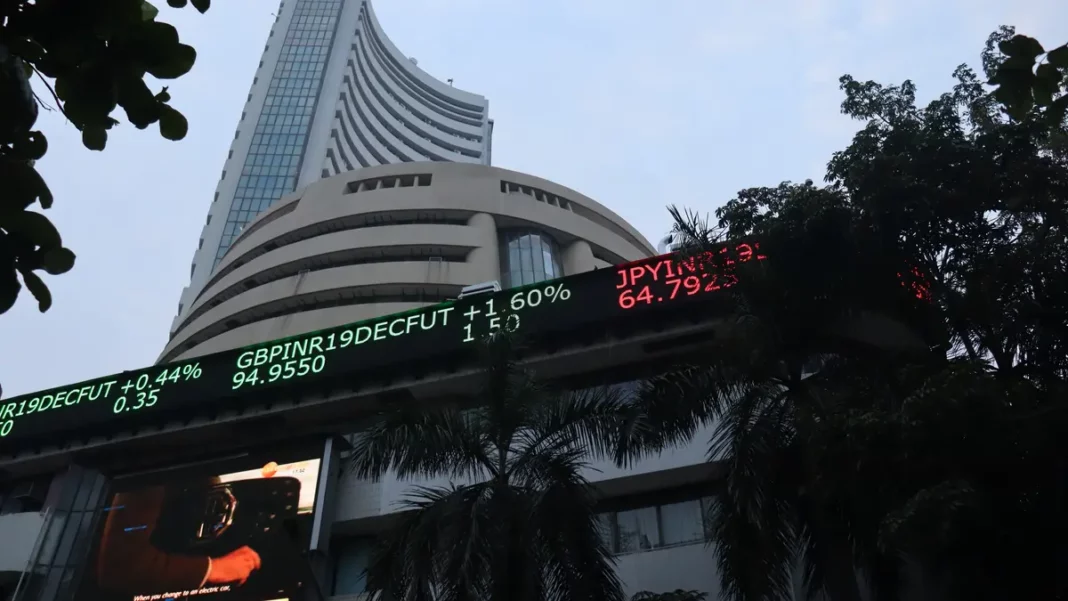
HDFC (NSE -0.54%) Securities has a buy call on ONGC or Oil And Natural Gas Corporation (NSE -0.56%) and has an ONGC target price of INR 220. The current market price of ONGC is INR 151.8. The analysts have given a one year (NSE-0.56%) when the ONGC share price target of 2022 can be reached. More about the company and its shares are in the write-up.
ONGC share price and ONGC NSE share price
Oil And Natural Gas Corporation Ltd was established in 1993 and are a Large Cap firm with a market cap of INR 191723.46 crore. The company operates in the Gas and Petroleum sectors.
Facts about ONGC and financial data
- The key products of Oil And Natural Gas Corporation Ltd’s main products/revenue sectors include-
- Oil crude
- Gas Natural
- Naptha
- Ethane
- Propane
- C2/C3 (Ethane/Propane)
- Butane
- HSD
- Subsidy
- Superior Kerosene Oil
- Electricity
- LSHS
- ATF or Aviation Turbine Fuel
- MTO or Mineral Turpentine Oil, etc., for the year ended March 31st, 2021.
- For the quarter that ended on 31.03.2022, ONGC had reported a Consolidated Total Income of INR 158648.42 Crore, which was up by 7.33% in comparison to the last quarter when the Total Income of INR 147814.67 Crore and up by 34.21%, in comparison to last year during the same quarter, the Total Income reported was INR118206.16 Crore.
In the table below, let us find out in detail about ONGC share price (both upside and downside) and ONGC share price forecast or target prediction.
| Target Prediction | For the Period |
| Friday June 10th 2022 | 157.65, 154.78, 151.9-Upside
129.95, 132.83, 135.7 -Downside |
| Friday 17th June 2022 | 165.66, 158.74, 151.81- Upside
121.94, 128.87, 135.79- Downside |
| Friday 24th June 2022 | 171.49, 161.56, 150.63- Upside
115.11, 126.04, 136.97- Downside |
| July 2022 | 168.52, 162.47, 156.42- Upside
133.98, 140.03, 146.08- Downside |
| August 2022 | 175.38, 166.75, 158.11 – Upside
127.12, 135.76, 144.39- Downside |
| September 2022 | 185.22, 173.16, 161.09-Upside
117.28, 129.35, 141.41- Downside |
| October 2022 | 197.36, 180.38, 163.39- Upside
105.14, 122.13, 139.11 – Downside |
| November 2022 | 209.1, 186.05, 162.99 – Upside
93.4, 116.46, 139.51 – Downside |
| December 2022 | 220.61, 191.69, 162.76 – Upside
81.89, 110.82, 139.74 – Downside |
The first upside and first downside targets are the best and the worst respectively. If there is a sharp rise or a sharp fall, these levels will indicate the maximum ranges. The second figures indicate the steady uptrend and downtrend, and the last or the third upside and downside targets are the numbers obtained in consolidated trading sessions.
If you want to invest in the ONGC share market, assess the upside and the downside figures before you can put your hard-earned money into it.
Also Read: Can a Startup Compete with Big Companies – Adopt the Right Strategies to Compete


